
The gender gap in LBS has doubled from 10% to 20% since LBS came under Employment Ontario (EO). The ratio of males to females was steady between 2005-2006 and 2011-2012 when there was a gap of about 10%. The dramatic change in the distribution of males and females occurred after LBS was formally systematized under EO in 2012-2013.
The actual number of females was incredibly stable over the past decade: 25,274 in 2005 compared to 25,304 in 2015. Whereas the actual number of males fell from 20,302 in 2005 to 16,752 in 2015. I can’t help but ask (thanks to the lyrics of Bonnie Tyler): Where have all the good men gone?
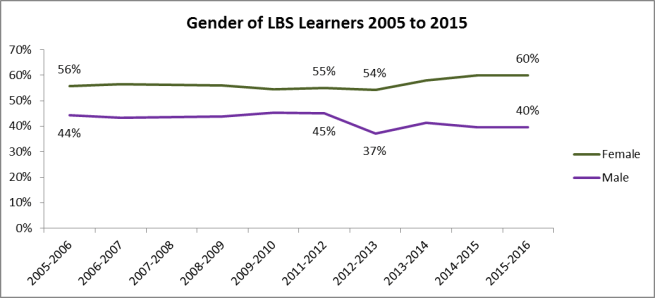
With the introduction of a new reporting and accountability system in 2012-2013 the once steady gender trend lines take diverging paths with a couple of dips and bumps along the way. Most noticeable is the proportional nose dive of males from 45% to 37% in 2012-2013 compared to the proportion of females, which remained steady. This is curious. Why would we see a dip in the proportion of men and not a corresponding increase in the proportion of females? About 9% are unaccounted for. More than likely, this is a reporting issue that impacts males more than females. But why the uneven impact? Perhaps males were double-counted more than females (an issue that directly impacted overall enrollment numbers). Once the new system was introduced, males showed a sharper decrease, and then their numbers levelled off at a lower proportion. In other words, perhaps a portion of the gender gap we see now was always there, but it was masked by double-counted males.
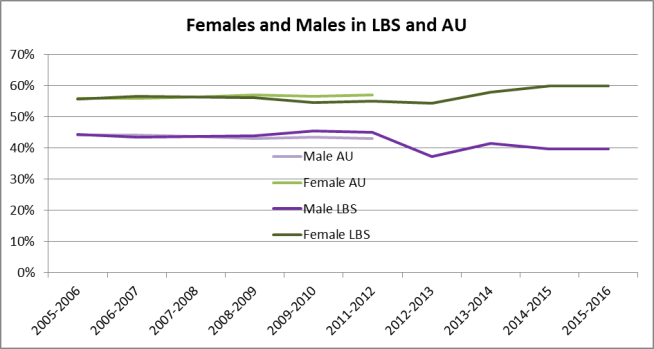
We need to look more closely at those learners in Academic Upgrading (AU), a program category that operated within LBS until 2011-2012 and led directly to double-counting. From 2005 until 2011 the number of learners enrolled in AU programs more than doubled. This increase coincided with funding increases. From what I understand, a learner could be participating in both the AU and LBS programs at the same time, and end up being counted twice in the reporting system.
As the number of AU learners doubled, were more males enrolling and being double-counted? Then, once the category disappeared, their numbers fell more than the numbers of females (showing that dip). The next question needs more math than I have: If there were more males in AU who could be double counted, perhaps this could artificially bolster the overall proportion of males in LBS. In other words, there never were that many males in LBS, and the 60-40 ratio is more accurate.
But when I looked only at AU numbers (lighter shades in the graph) they do not indicate an increase in the number of males. In fact there was a 1% increase in the proportion of females and a corresponding drop in the proportion of males in AU during this period. Double-counting and reporting issues don’t provide an adequate explanation for the increased gender gap, based on the data that I have.
Reporting issues may have led to a temporary dramatic drop of 8%, particularly if we consider that 9% of learners in 2012-2013, the year the new system was introduced, were not categorized. Once the initial problems implementing a new reporting system were addressed, we still have an overall drop of 4% of male learners the following year. An additional decrease of 1% occurred the year after.
| Males | Change from previous year | |
| 2011-2012 | 45% | No change |
| 2012-2013 (new system) | 37% | -8% |
| 2013-2014 | 41% | -4% |
| 2014-2015 | 40% | -1% |
| 2015-2016 | 40% | No change |
One thing that is more certain is the development of a widening gender gap. We need to better understand why this could be happening.
- Has something happened in LBS to dissuade more males than females from enrolling? Did the introduction of new processes for learners, including a lengthy new registration process, an increase in the number of assessments and a unique curriculum, have an impact?
- Is something happening within the broader Employment Ontario system? Are more program options available for males or are males and females steered into different programs? Perhaps more women choose to participate in LBS for reasons that are different than men.
- Is Employment Ontario seeing similar trends as LBS? Are more men working and/or engaged in other forms of education and training? Are they directed into different programs outside of Employment Ontario? Can they access different opportunities?
Hopefully, this is the beginning of an important conversation that we can have with the ministry, which has the data and expertise to support a more thorough analysis. Readers, please comment or get in touch directly if you have insights and experiences to share to help us all understand what may be happening.
